Analytics
5 Dashboard
The home page: how many genuine scans you get, how that is trending, which carriers customers use and where they are.
本章节暂未提供中文版本,您正在阅读英文版本。
访问权限 everyone; data limited to your assets许可证 Geolocation analytics for the country map
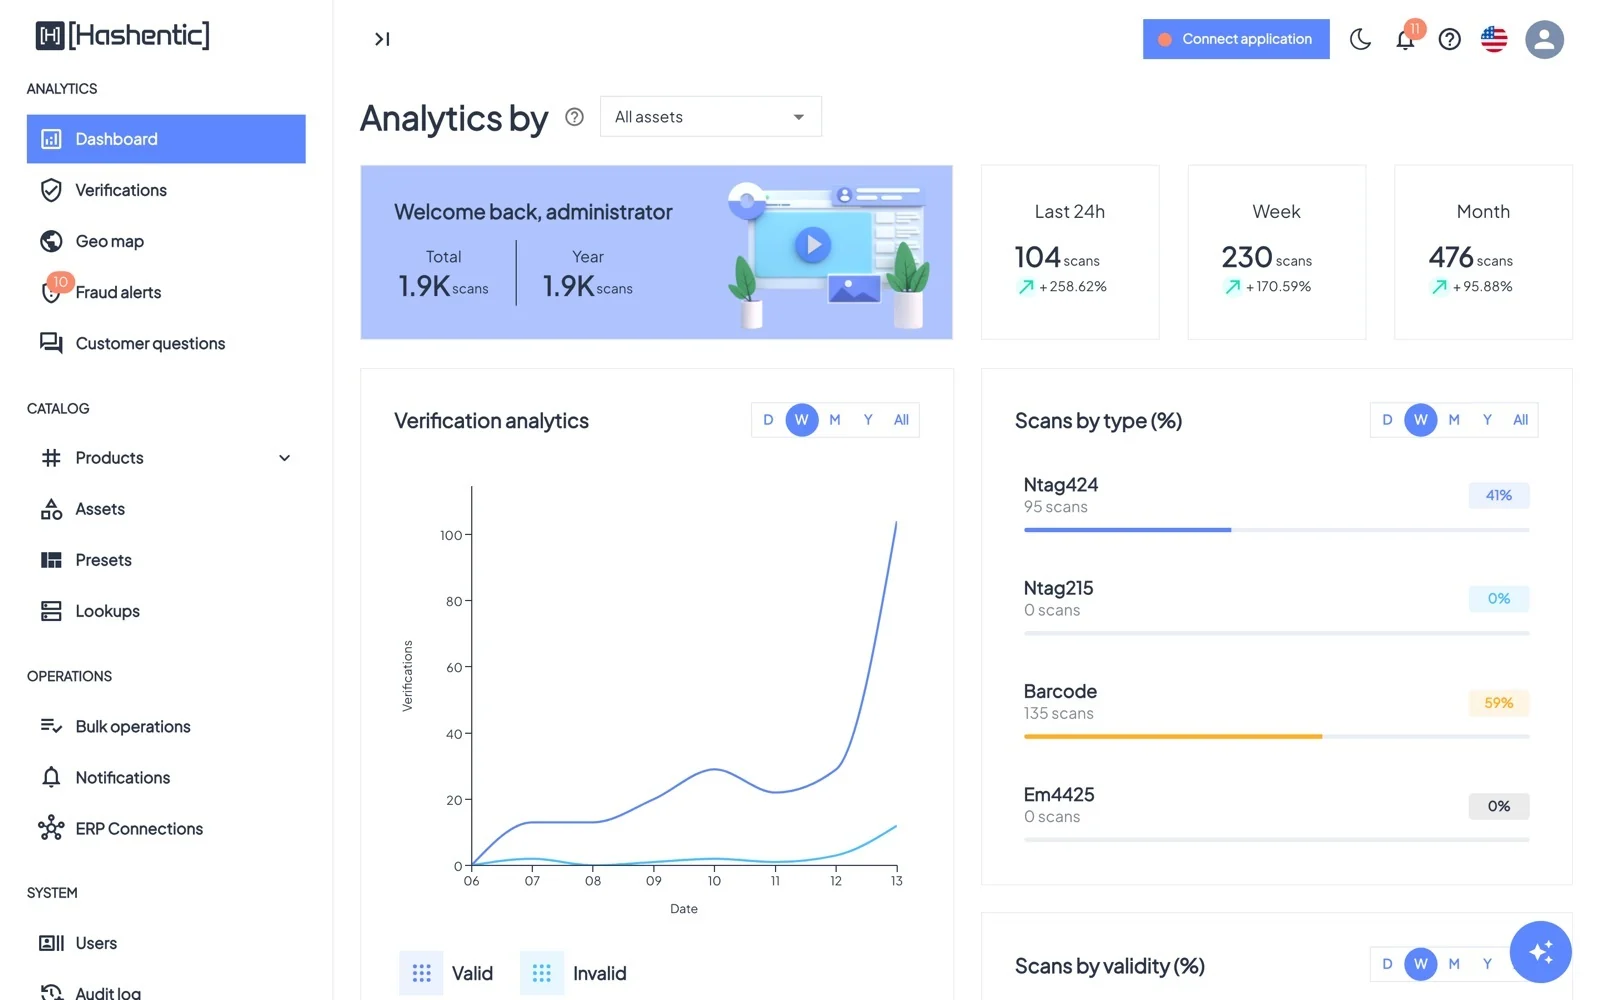
- Welcome card with Total and Year, plus Last 24h, Week and Month cards with the trend against the previous period. These count genuine (valid) scans.
- Scans by type (%): the share of NTAG 424, NTAG 215, EM4425 and barcode scans.
- Scans by country: a world map shaded by genuine scans per country.
- Verification analytics: valid and invalid scans over time. Switch the period with D W M Y All.
- Scans by validity (%): genuine vs. failed checks.
- Drill down anywhere: click a number, a chart series, a type row, a pie slice or a country to open the list of the scans behind it.